
In the classic science-fiction film “The Matrix,” the main character, Neo, learns a thought-provoking lesson from a wise child, who apparently uses telekinetic powers to bend a spoon. As the boy tells a bewildered Neo, the truth of the matter is that he’s not directly manipulating physical objects. Instead, he has transcended the limitations of the current ontological paradigm by coming to a radical conclusion.
There is no spoon. And by the same logic, there is no valuation.
Of course, I’m not suggesting that there is no such thing as market capitalization or myriad other relative valuation metrics. Such figures are factual measurements. What I’m distinguishing is the valuation labels stemming from normativity, which is anchored in a moral ontology. Terms like “undervalued”, “overvalued” or “priced to perfection” smuggle in a judgment that has never actually been proven to exist in objective space.
While this ontological tension might not matter as much for long-term buy-and-hold investors, these labels should not (in my opinion) be used in options trading. Options, as I’ve previously explained, is a multiverse. When you look at the options chain of any eligible security, you’re witnessing a market of alternate realities — with individual traders speculating on or hedging against these projected outcomes.
To make sense of this chaotic environment, you cannot think in terms of valuation. As soon as you fall into this rhetorical trap, you begin thinking in terms of “ought-to” logic. Under this framework, an undervalued stock ought to rerate higher. But such an assertion begs the question as it smuggles the conclusion (that the stock should rerate higher) into the premise (that it’s undervalued).
Instead, we need to think in terms of probabilistic mass and risk geometry. To do that, we’re going to combine empirical data — which hails from Barchart Premier — and hierarchical frameworks under a quantitative lens.
Oracle (ORCL)
If we took a single 10-week strand of pricing data from Oracle (ORCL), the return during this period won’t tell us much about the performance probability of the other weeks. However, if we took hundreds of rolling 10-week sequences of ORCL stock and arranged them in a distribution, the most frequent, consistent performances would lead to bulges in probability mass. These bulges represent risk geometry, which allows us to make smarter decisions.
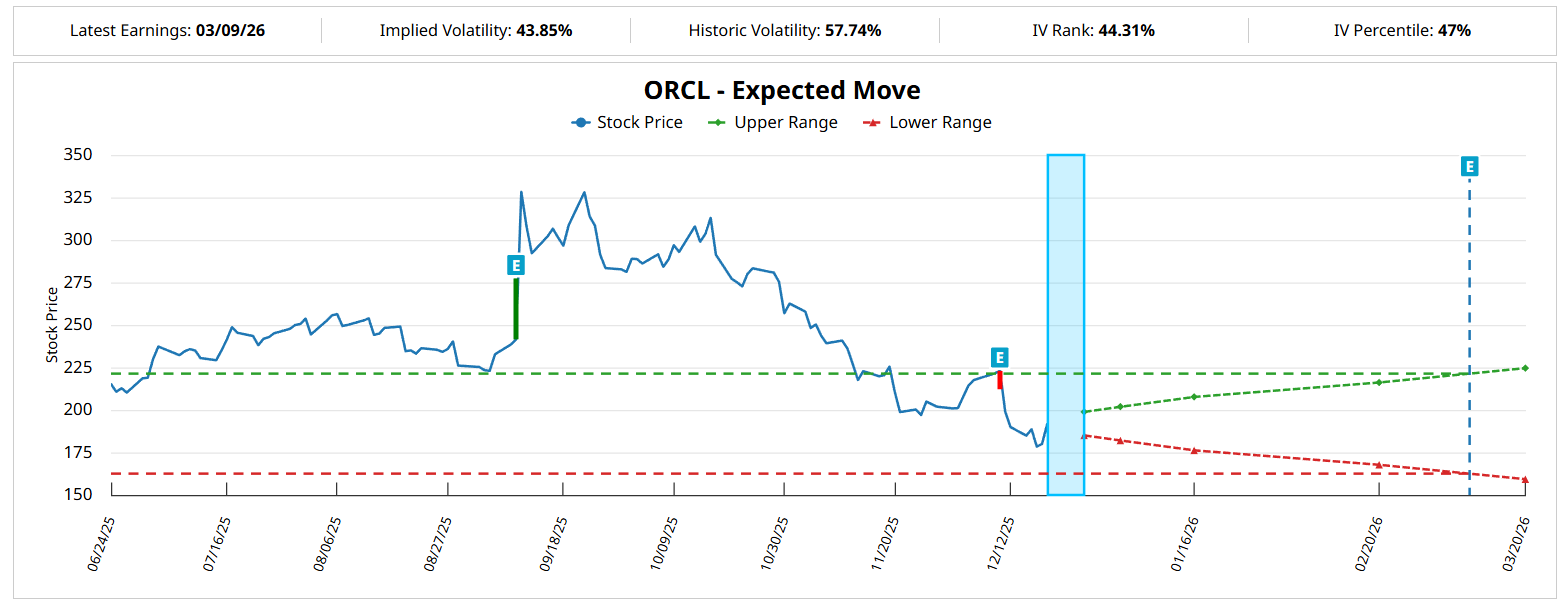
First, we should consider what the options market as a whole is anticipating for ORCL stock via the Expected Move calculator. For the Feb. 20, 2026 options chain, implied volatility (IV) — which is a residual metric derived from actual order flows — presumes through a reverse-engineering process a price range of $167.79 to $216.15. While instructive, we’re not quite sure where ORCL may land within this wide dispersion.
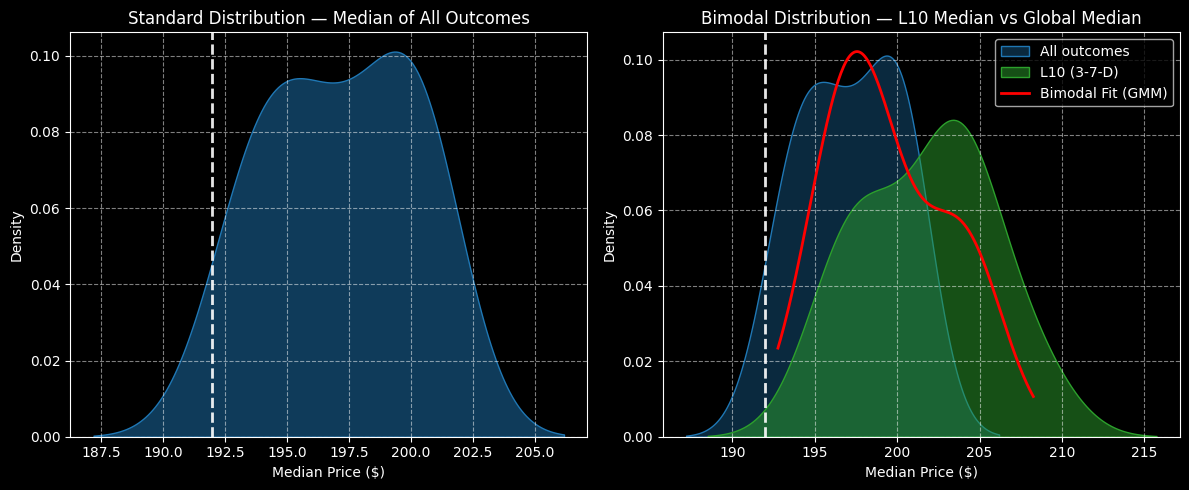
Through an iterative process, though, ORCL’s 10-week distribution since January 2019 can be calculated, with outcomes ranging between $187.50 and $206 (assuming an anchor price of $191.97). Further, probability mass would be thickest between $195 and $200.
However, we’re interested in the current quantitative signal, which is the 3-7-D sequence; that is, in the past 10 weeks, ORCL stock printed only three up weeks, leading to an overall downward slope. Under this setup, the forward 10-week returns would likely range between $190 and $215. Probability mass would be thickest between $200 and $205.
Given the market intelligence above, the 195/200 bull call spread expiring Feb. 20 could be a prudent idea.
NextEra Energy (NEE)
While NextEra Energy (NEE) offers a relevant business — standing as the world’s largest electric utility holding company by market cap — its performance hasn’t really been up to par this year. Since the beginning of January, NEE stock has only moved up 11%. In contrast, the benchmark S&P 500 is up over 16% during the same frame.
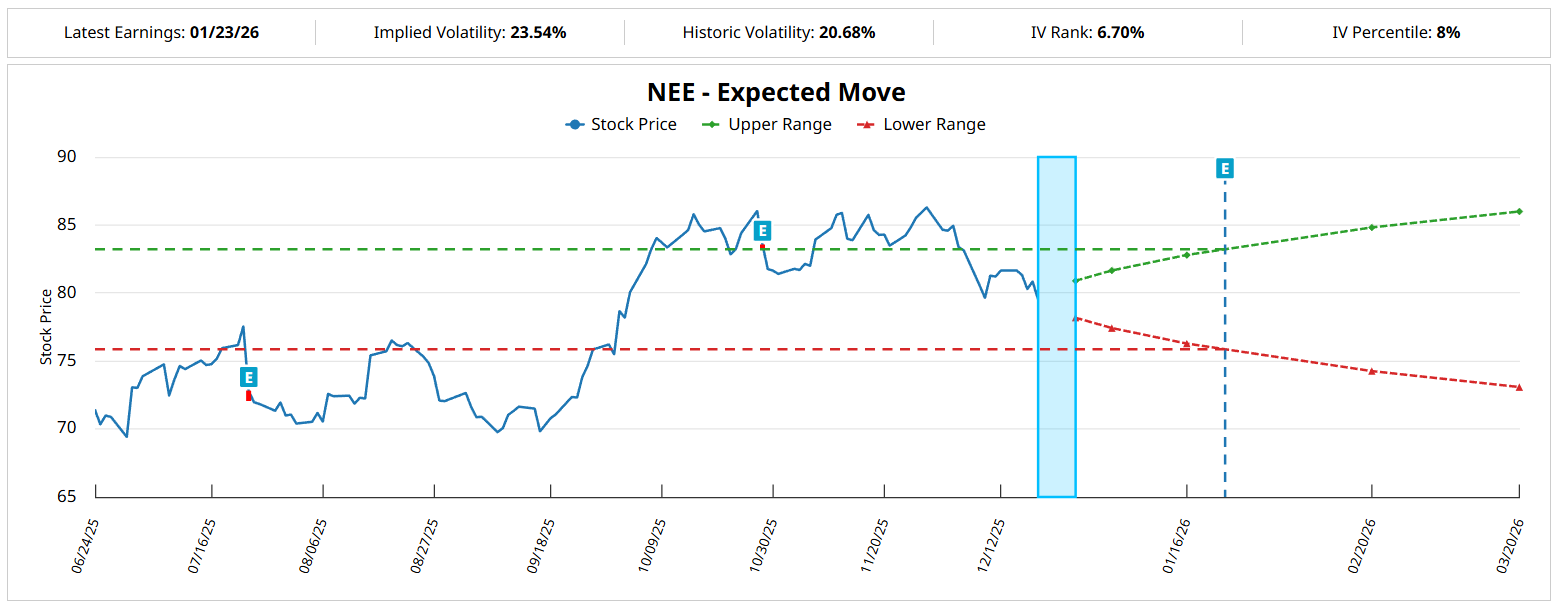
Still, the downside could bring about an opportunity. According to the Expected Move calculator, the IV dynamics basically project a price range between $74.26 and $84.82 for the Feb. 20 options chain. The expected move is plus or minus 6.64% from the anchor price of $79.54, Friday’s close. Again, we’re not entirely sure where NEE stock may end up within this dispersion.
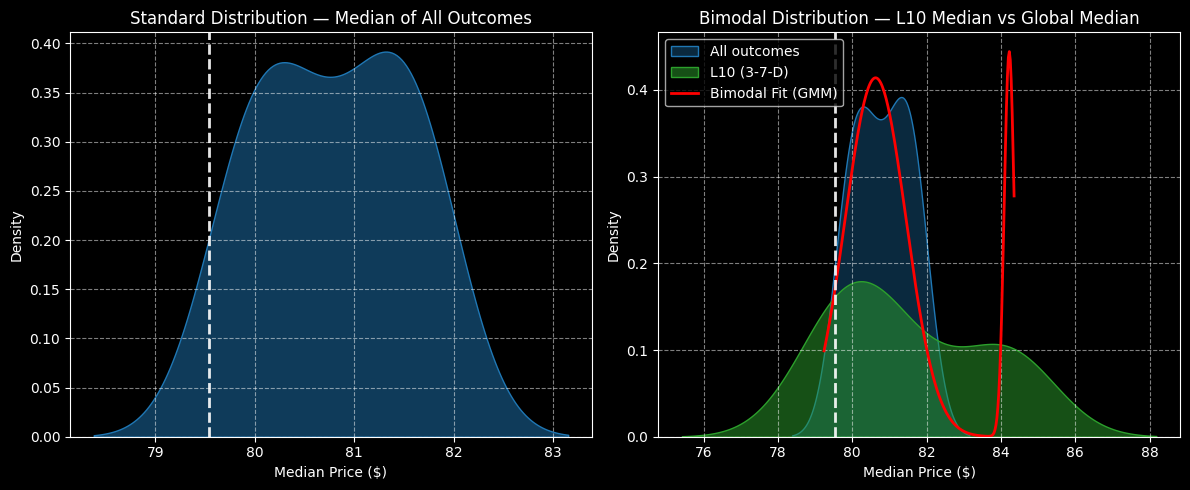
To get a better idea, we’re going to run a distributional analysis. Over the next 10 weeks (using data from January 2019), NEE stock should range between $78 and $83, with probability mass thickest between $80 and $81.70.
However, the current quant signal is structured in a 3-7-D formation. Under this setup, the forward 10-week distribution would likely range between $76 and $88, with primary price clustering likely to be predominant at $81. Nevertheless, probability decay occurs gradually, with secondary price clustering likely to materialize at $84.
While this trade presents risks, the 80/85 bull spread expiring Feb. 20 is intriguing.
Iron Mountain (IRM)
Perhaps an unusual idea for an options trade, Iron Mountain (IRM) has really struggled this year. An enterprise information management services company, Iron Mountain is in the data protection and recovery services industry. It should be relevant but the market doesn’t quite think so, with IRM stock down 24% since the January opener. Nevertheless, it’s possible that the red ink could offer a contrarian play.
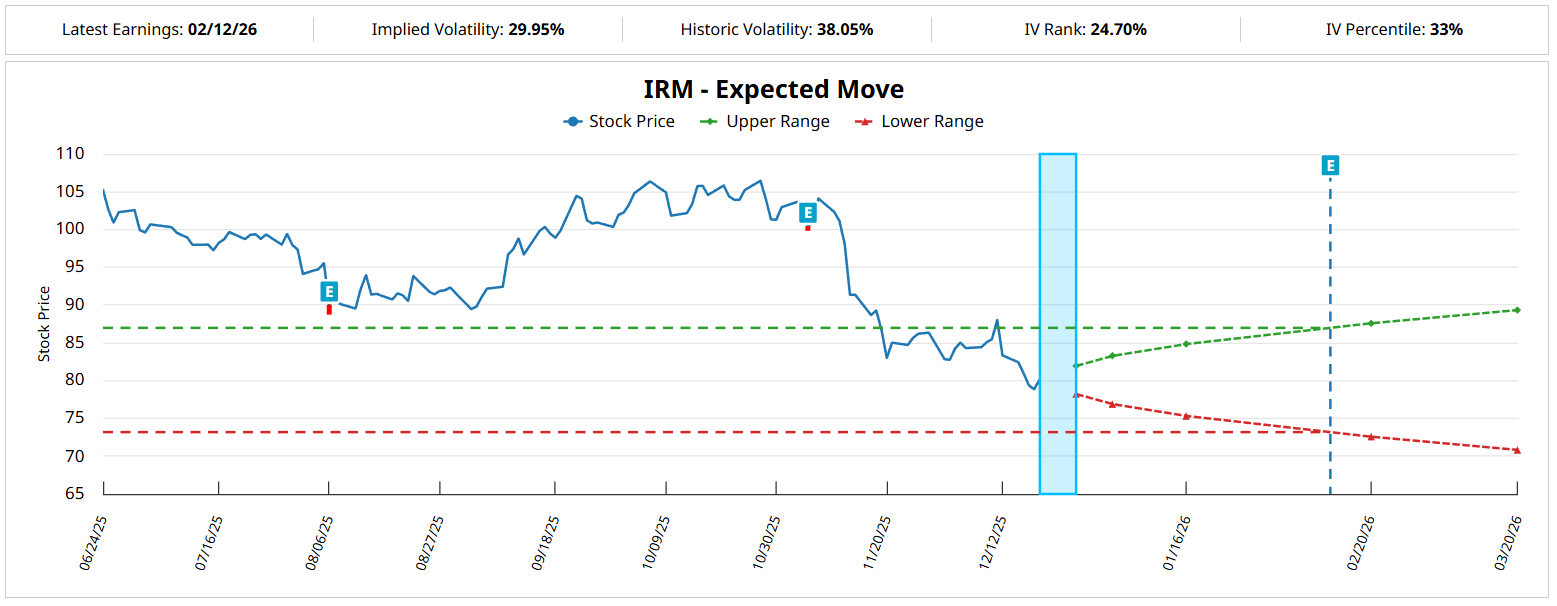
If we look at the Expected Move calculator for the Feb. 20 options chain, the reverse engineering of order flow data effectively shows an anticipated price range between $72.59 and $87.59. Basically, traders appear to be hedging for massive kinesis, as the data indicates a 9.36% move in either direction relative to the anchor (Friday’s close of $80.09).
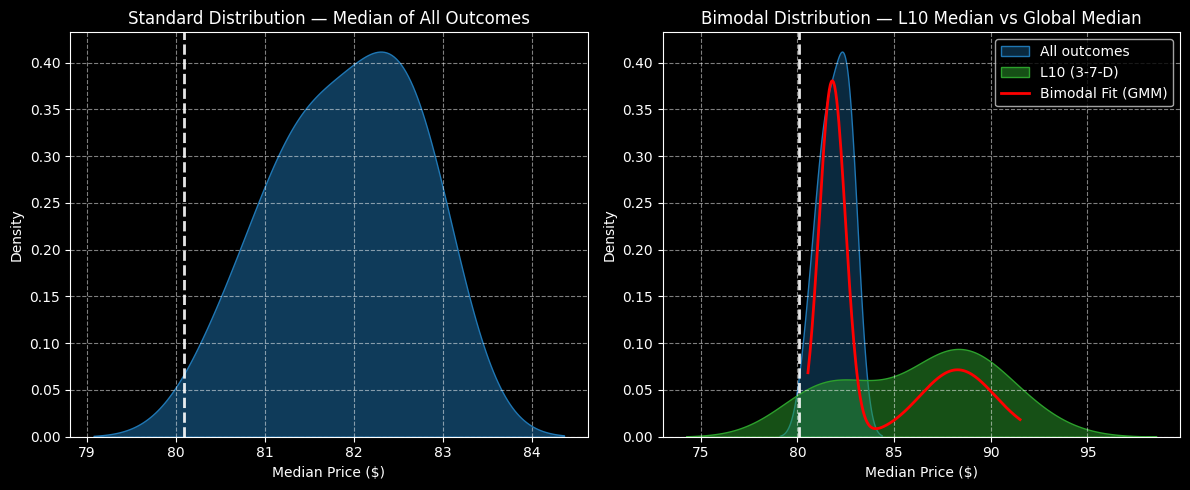
To find out where IRM stock is likely to coalesce within this dispersion, we’re going to conduct distributional analysis. Since January 2019, the forward 10-week returns of IRM are likely to range between $79 and $84.60, with price clustering likely to be predominant at around $82.30.
However, under the current 3-7-D sequence, the forward 10-week returns would likely range between $75 and $98. Moreover, price clustering would likely be predominant at $88, with probability mass projected to be quite robust up to around $92.
With that in mind, I’m a huge fan of the 80/90 bull spread expiring Feb. 20, especially because of its max payout of 150%.
On the date of publication, Josh Enomoto did not have (either directly or indirectly) positions in any of the securities mentioned in this article. All information and data in this article is solely for informational purposes. For more information please view the Barchart Disclosure Policy here.
More news from Barchart
- The Saturday Spread: How a Little-Known Options Strategy Targets Asymmetric Upside (ORCL, NEE, IRM)
- ConocoPhillips Stock Still Looks 18% Undervalued - How to Play COP Stock?
- Nike, Tilray, and Palantir: Their Unusually Active Put Options Will Boost Your Wallet After Christmas
- Silver Prices Are Flying. Should You Try to Catch the Rally, or Bet Against It?